SCIPLOT INTERACTIVE PLOTTING
PROJECT UNDER CHARLES CAMP JR. AT THE NATIONAL INSTITUTE OF STANDARDS AND TECHNOLOGY - SUMMER 2016
Python, Matlab
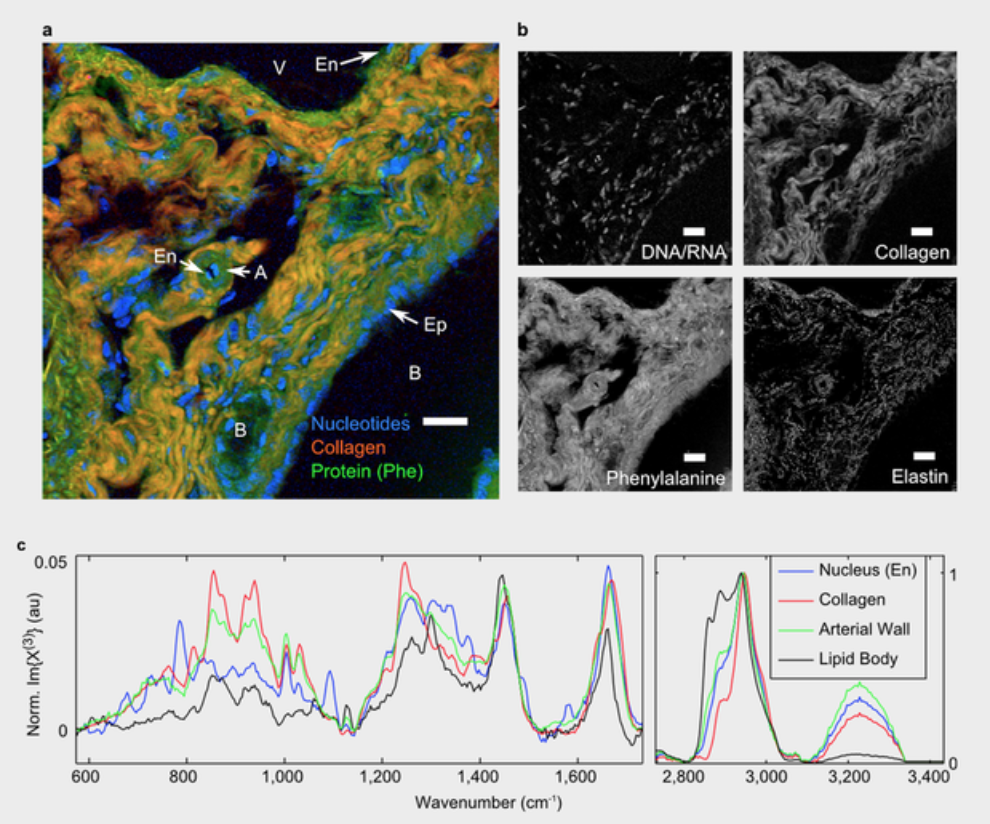
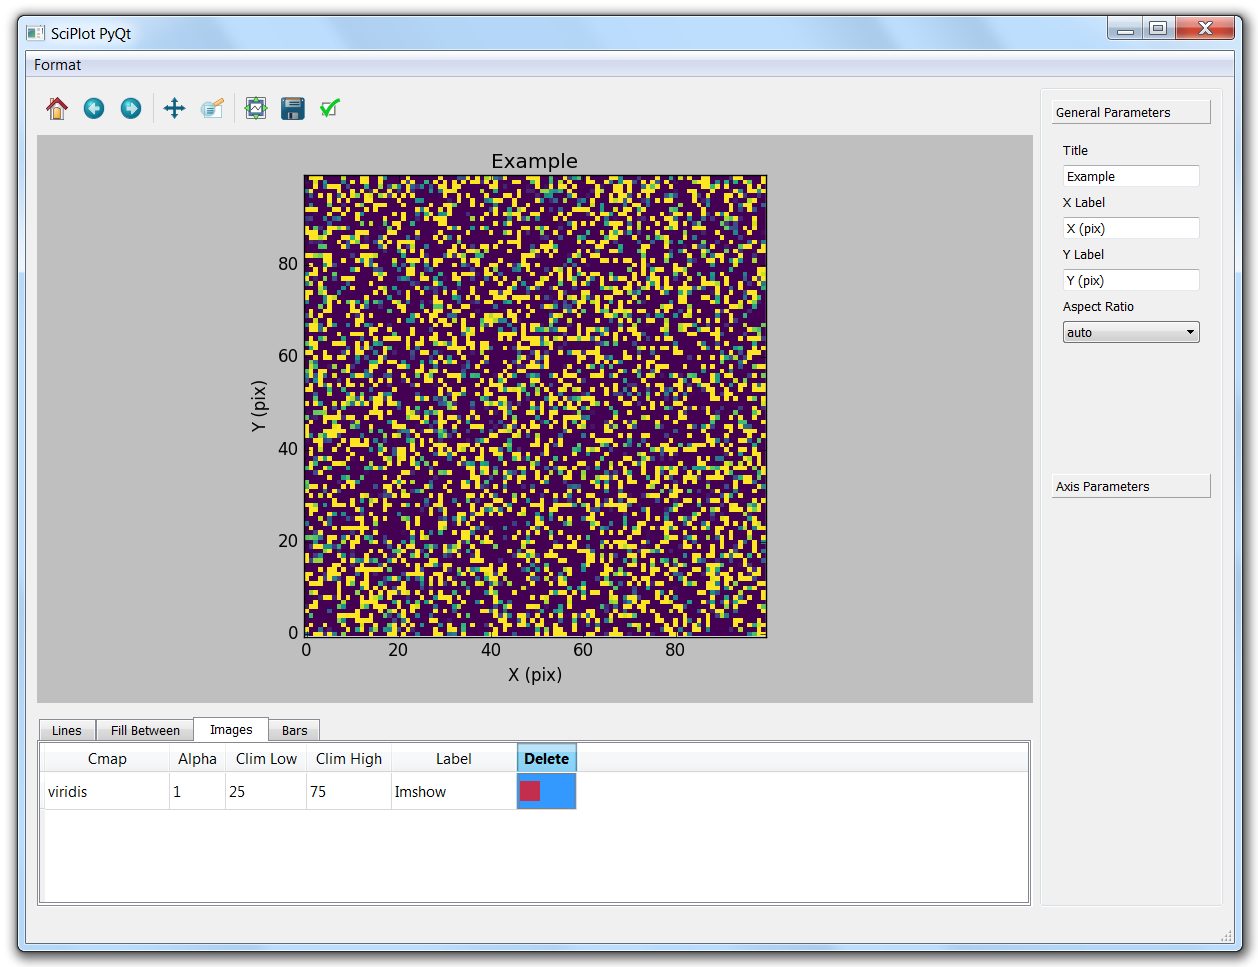
As part of the Summer High School Internship Program at the National Institute of Standards and Technology in Gaithersburg, Maryland, I worked under Dr. Camp in the Material Measurement Laboratory to develop software for his project SciPlot, a user-interface/matplotlib wrapper built with PyQt5 that allows interactive plotting through an embedded matplotlib canvas. It creates fast and easy publication-ready plots and images and I worked on the plotting for data received from Raman spectroscopy.
Raman spectroscopy is an imaging technique used to determine vibrational modes of molecules and provides a structural fingerprint for the chemical composition of a sample. First, I analyzed the output data (with values ranging from 0-1,000,000) using a recursive program in Python to determine common peaks and accounting for small variations in value. Then, I compared these values to known values from academic research that correspond to different chemical compounds such as carbohydrates or collagen.
Finally, I developed the plotting function within SciPlot in order to identify and visualize the determined chemical components based on the data received from Raman spectroscopy.
Github Code